
- Log in to post comments
 3 months are gone after release of EasyDABv2 hardware. It's time to publish some measurements and enchancements for this hardware. Here is short way of enchancing output signal.
The list of hardware, which has been used for measurements is:
- R&S ETL Digital TV analyzer.
- R&S FSU Spectrum analyzer.
- QS1R - Direct Sampling Receiver with 16bit ADC.
- RTL-SDR stick with patched gr-dab modules.
Here is list of fixes, that has been applied to the hardware/firmware update, released on the board's page:
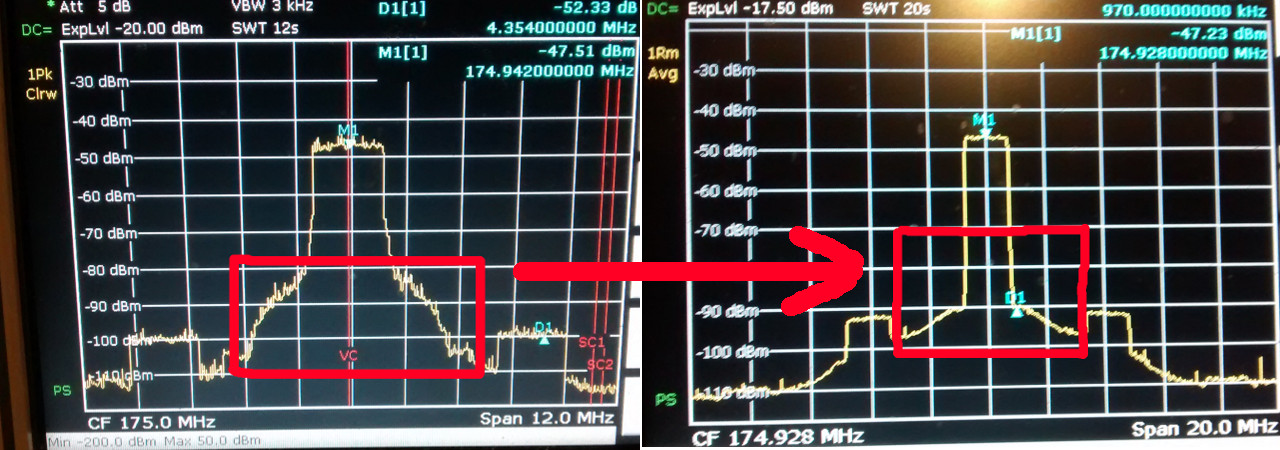
- Phase noise decreased by tuning PLL loop filter resistor and capacitors values. Previously PLL bandwidth was 50KHz, for now it has been increased to 1.2 MHz (it can be increased up to 2MHz, but crystal spures amplitude will be higher in that case).Here is spectrum images before and after values changed:
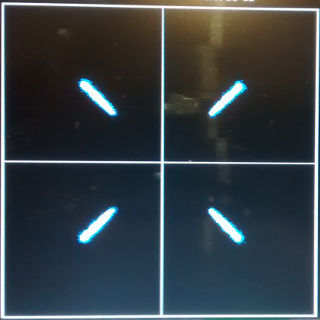
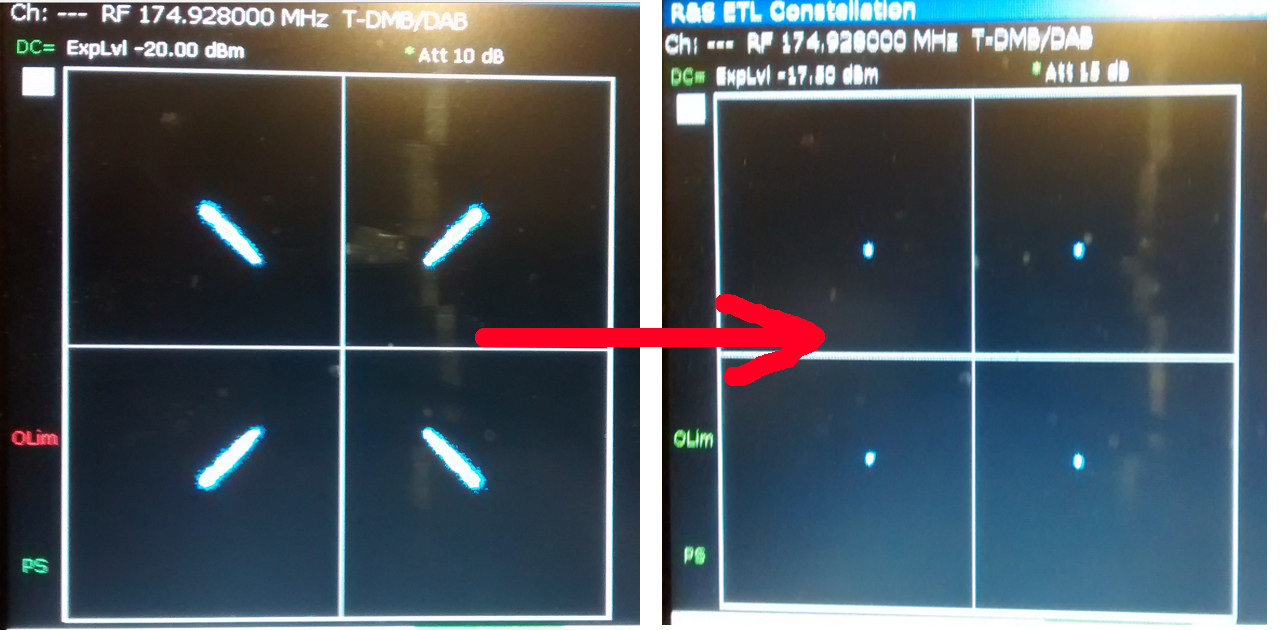
- Gain control module has been removed, because of constellation map was not stable (amplitude jumping too highly between minimal and maximal values), but after this change, it's became much more "dot like", instead of "line like":
Also, after this change, ETL shows much better Modulation error rate:
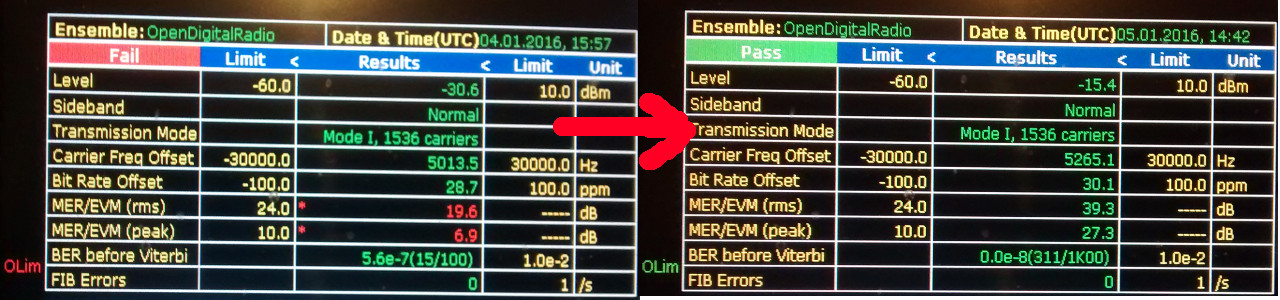
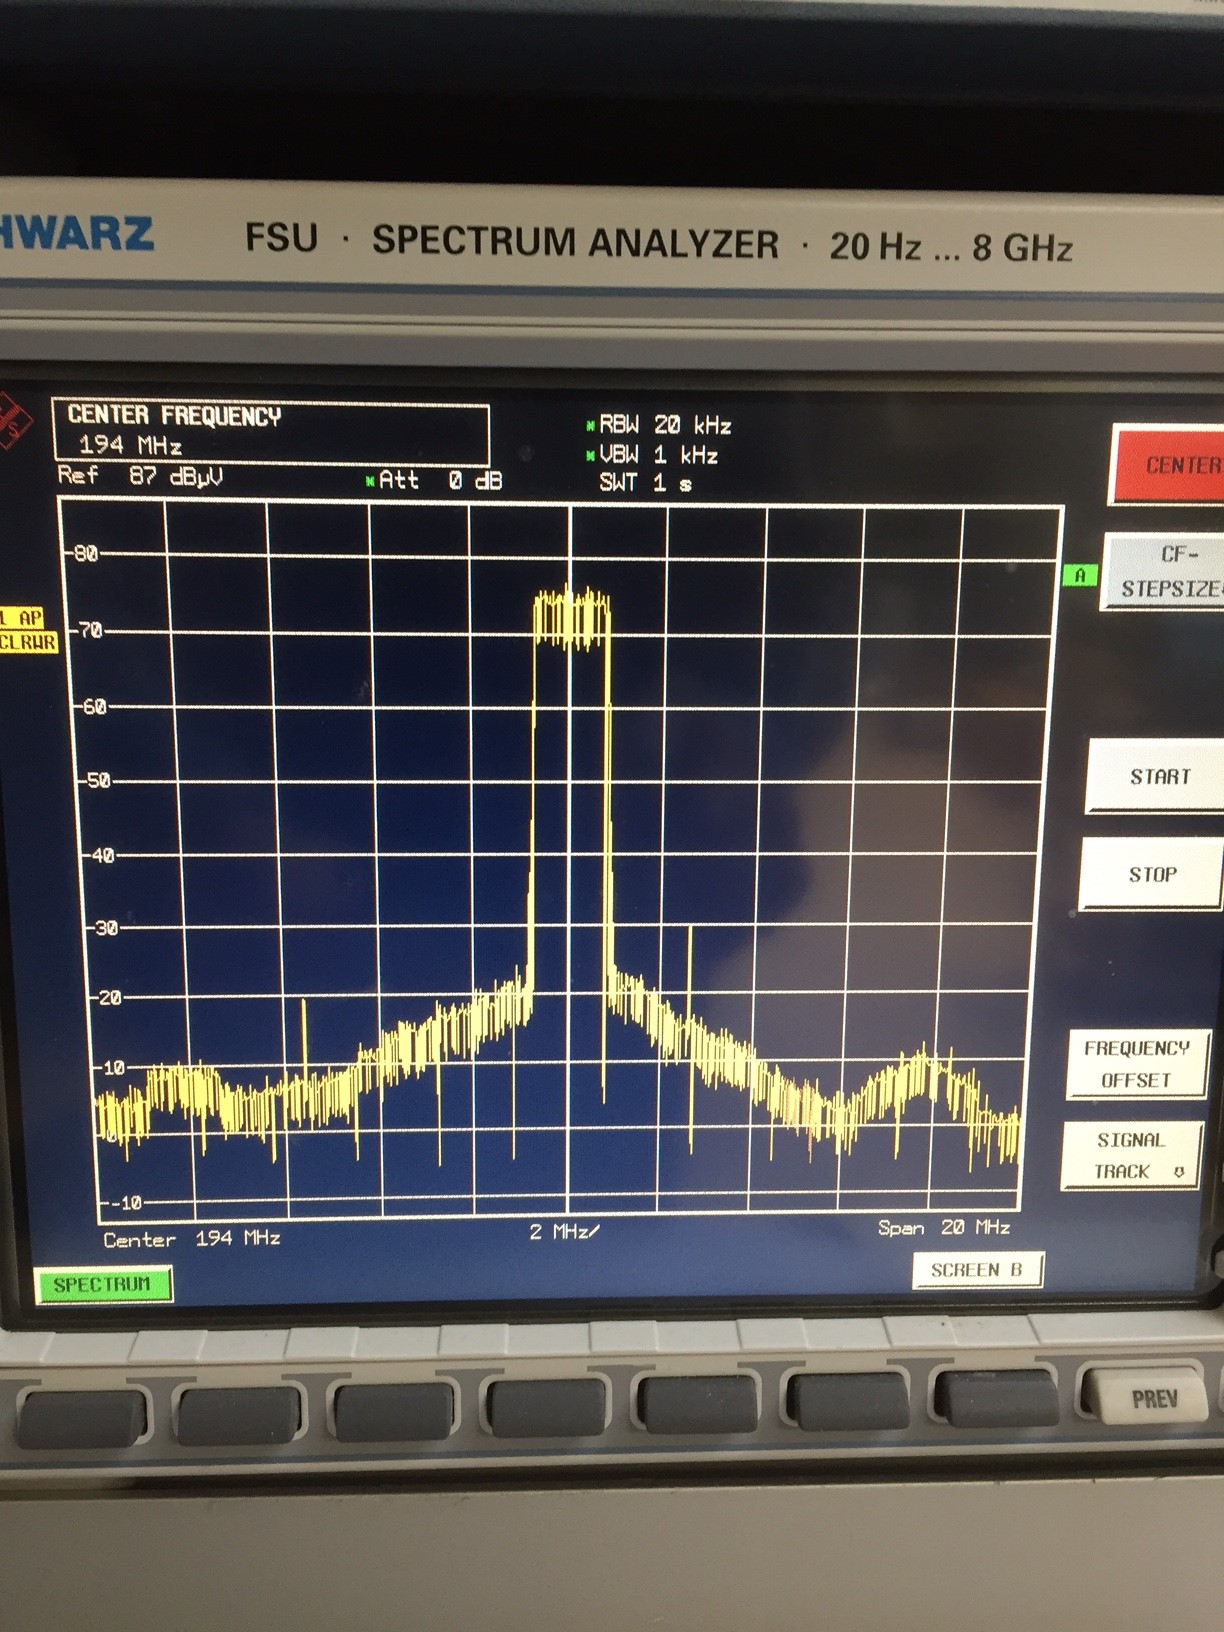
Unfortunaly, this change decreases output power from 180mW down to 40mW. But this is ok, since distance, on which receiver can tune to the station decreases only about 25%. So signal is less stronger but pretty much stable from amplitude deviation view. - Sample rate of the I/Q data samples that is passed to AD9957 QDUC increased from 2048 kSamp/sec up to 8192 kSamp/sec. Also additional interpolation FIR filter added into firmware, it's target role - is to increase samplerate and filter unneeded images, that presented at +/- 4096 KHz:
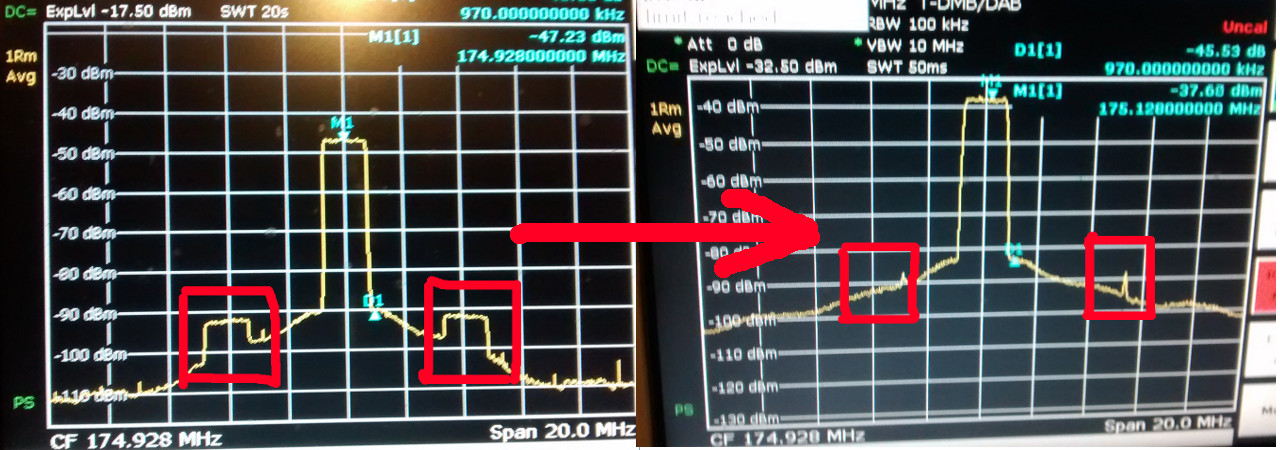
Now 20 MHz spectrum span looks prettier than before:
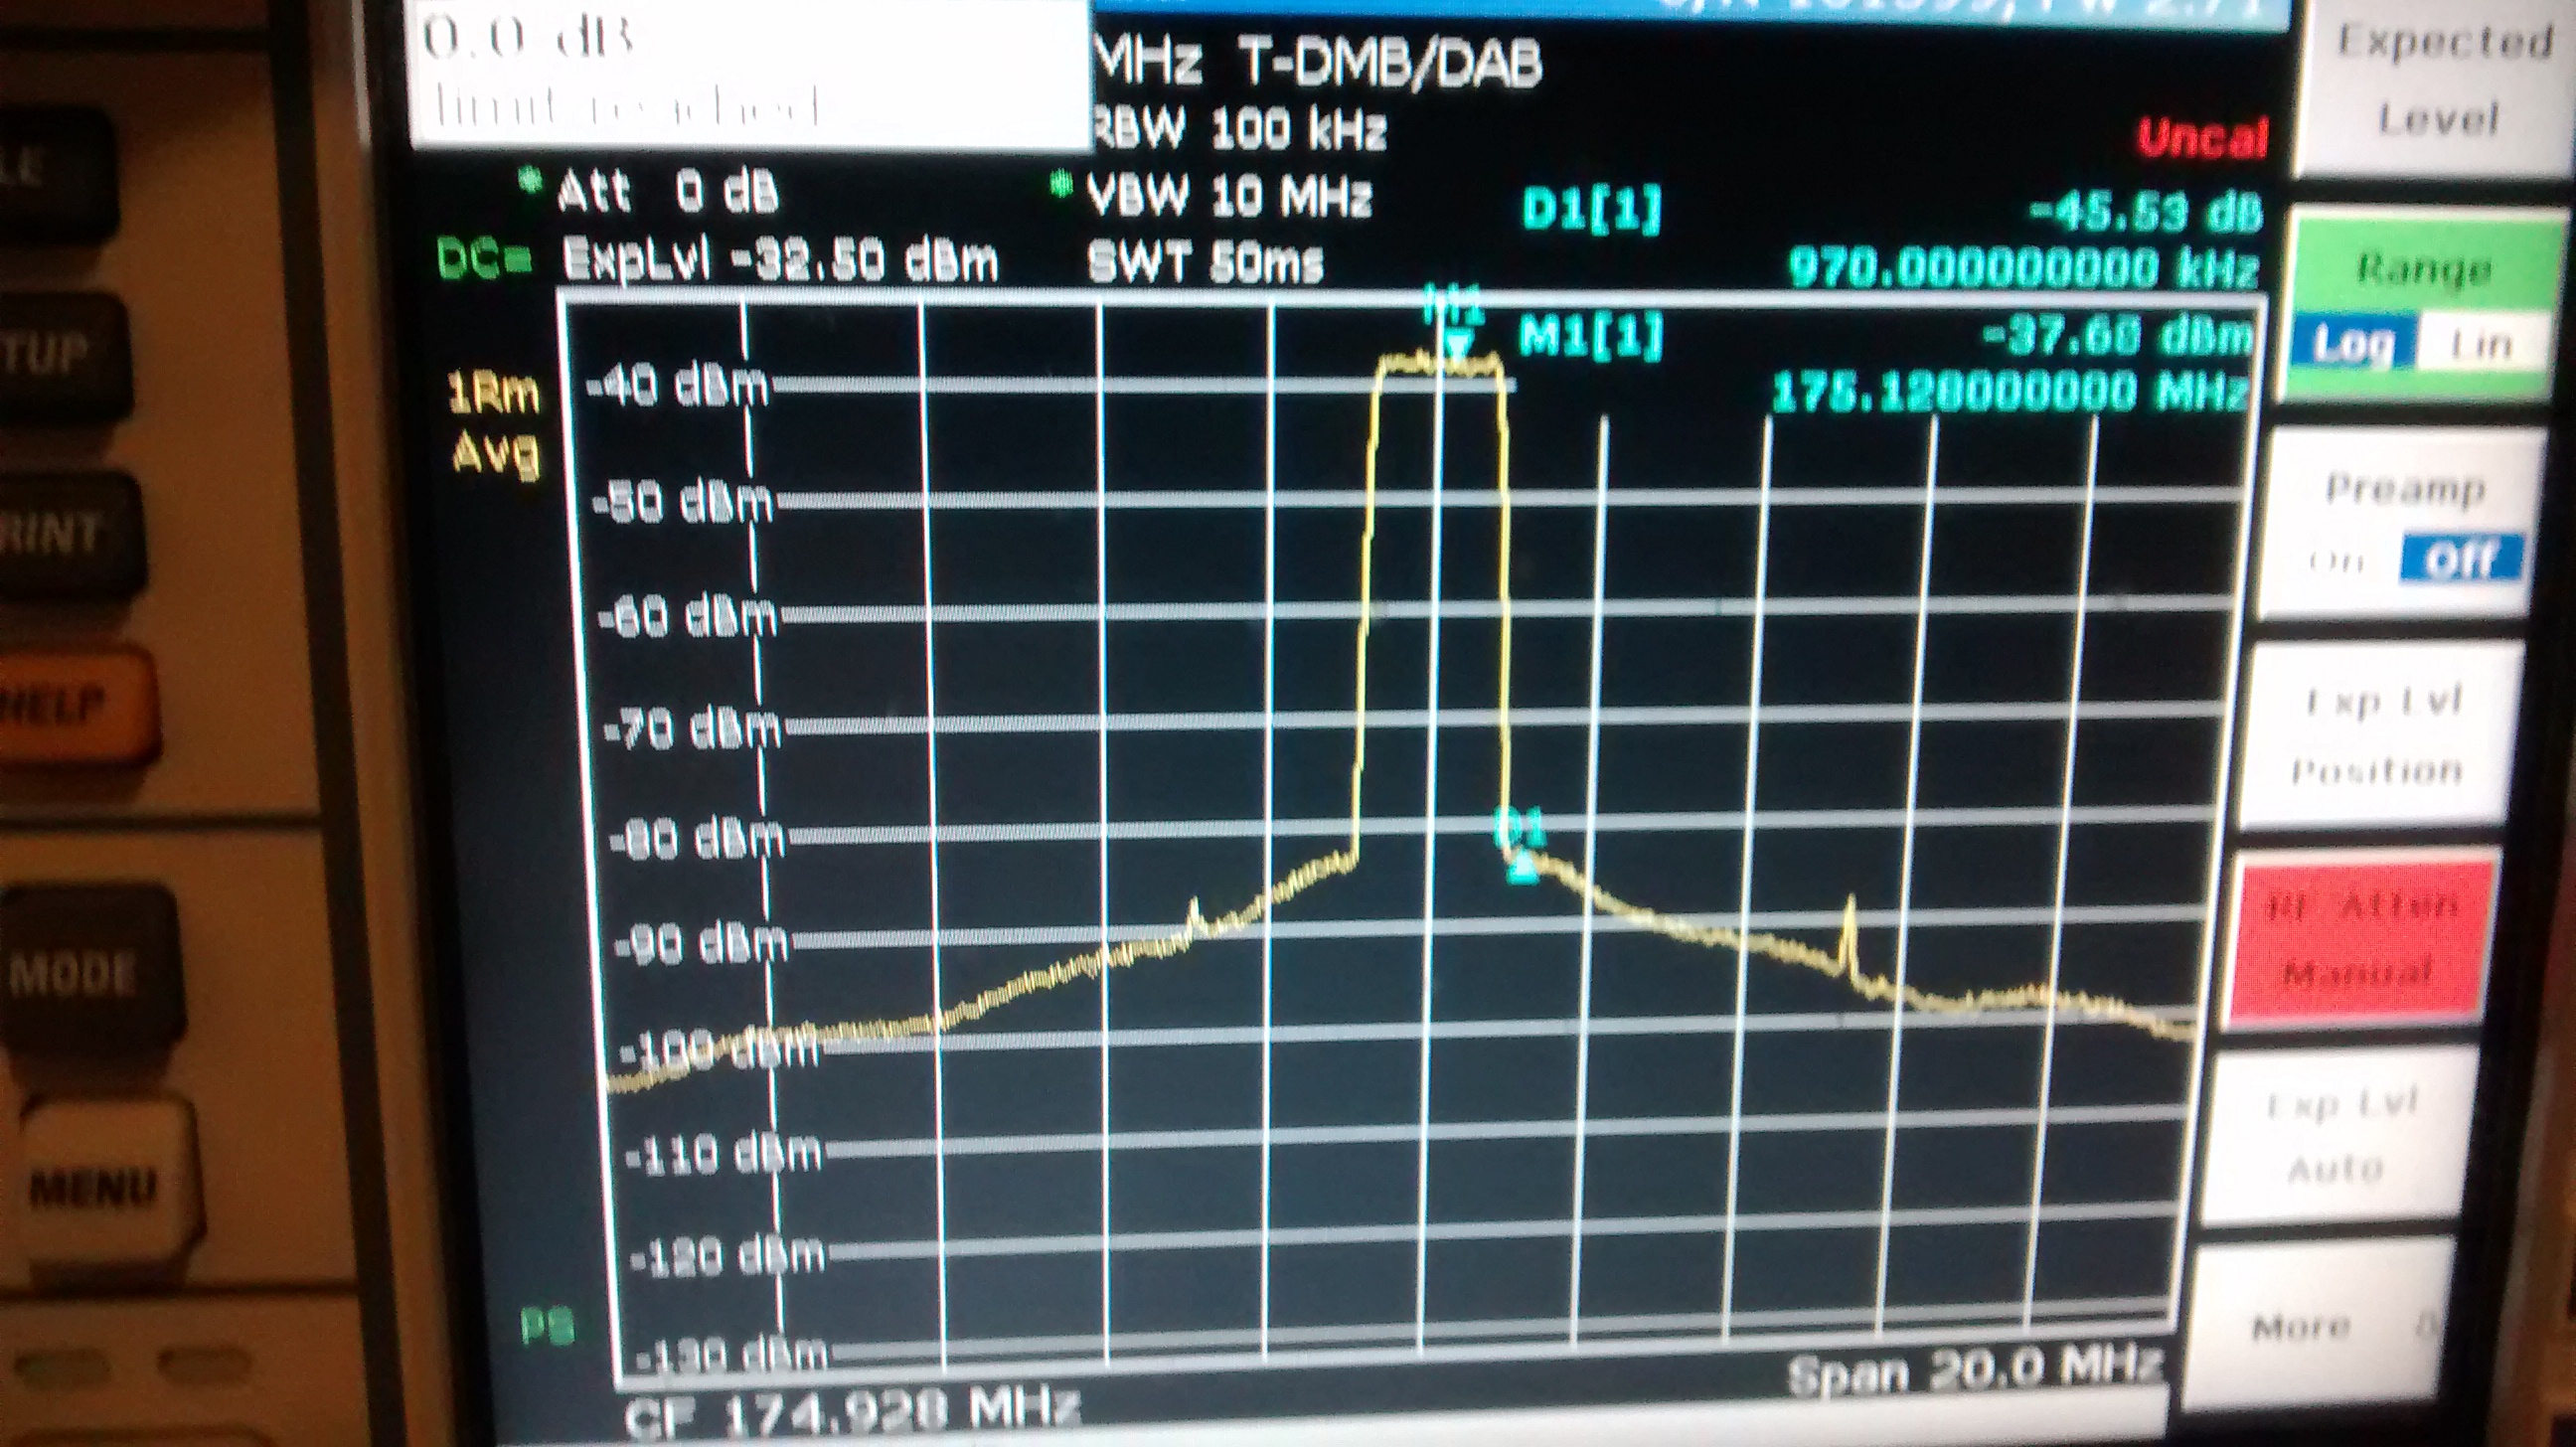
Output spectrum - still have some spures and dead frequencies, which have to be filtered before transmitting sighal to the air or passed to the amplifier.
Here is some constants for calculations:
Crystal freq:
Fq = 24.576MHz
More measurements photos:
no_gain_2048 - R&S measurements result of 2048 kSamp/sec firmware, where PLL loop filter has been enchanced and gain module removed from firmware.
RS_FSU - This directory contains R&S FSU measurement results, that show enchancement of changing samplerate 2048->8192.